
The Greece Schengen Visa Statistics show a strong long-term pattern of high demand, a deep pandemic-era drop, and a steady recovery through 2024. Since 2014, Greece has received 8,207,521 visa requests, with an average of 746,138 applications per year.
Greece Schengen Visa Statistics & Trends Analysis
- Total applications (2014–2024): 8,207,521.
- Average annual applications: 746,138.
- 2024 applications: 710,024, which is 13.24% higher than 2023.
- 2024 share of all Schengen visa applications: 6.06%.
- 2024 ranking among Schengen countries: 6th.
- 2024 approval rate: 86.11%.
- 2024 rejection rate: 13.13%.
Greece Schengen Visa Statistics (2014–2024) — Applications, Approvals, Rejection Rates
The yearly figures below come directly from the Greece statistics page and show how applications, approvals, and rejections changed year by year.
| Year | Applications | Approved | Denied | Approval Rate | Rejection Rate |
| 2014 | 1,375,287 | 1,347,479 | 27,465 | 97.98% | 2.00% |
| 2015 | 876,786 | 848,593 | 27,668 | 96.78% | 3.16% |
| 2016 | 986,032 | 958,673 | 27,359 | 97.23% | 2.77% |
| 2017 | 1,029,564 | 989,595 | 39,969 | 96.12% | 3.88% |
| 2018 | 855,285 | 813,272 | 42,013 | 95.09% | 4.91% |
| 2019 | 880,892 | 835,865 | 39,342 | 94.89% | 4.47% |
| 2020 | 111,870 | 98,279 | 8,971 | 87.85% | 8.02% |
| 2021 | 295,634 | 274,836 | 18,545 | 92.96% | 6.27% |
| 2022 | 459,139 | 396,432 | 56,566 | 86.34% | 12.32% |
| 2023 | 627,008 | 530,435 | 91,379 | 84.60% | 14.57% |
| 2024 | 710,024 | 611,396 | 93,260 | 86.11% | 13.13% |
10 Year Evolution in Greece Schengen Visa Application Trends
This 2014–2024 series shows three clear phases: a strong pre-2019 base, a steep fall during the pandemic, and a partial recovery afterward. Greece’s application volumes stayed high in the years before 2020, then dropped sharply in 2020 and 2021 before rising again in 2022, 2023, and 2024.
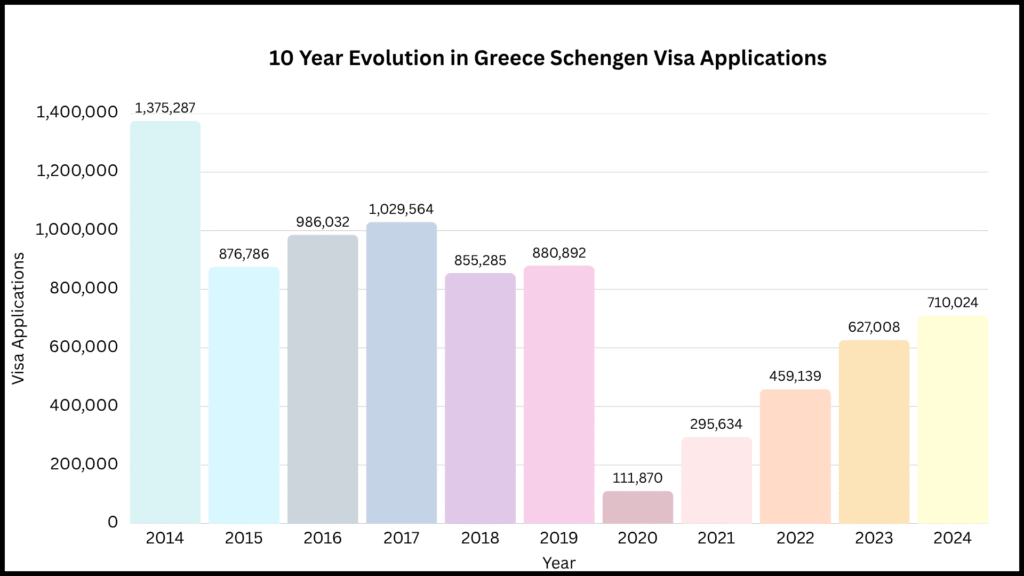
What the Trend Shows
- High pre-2019 demand: Greece stayed a major Schengen destination before the pandemic, with very large annual application totals and strong approval levels.
- Sharp pandemic collapse: Application volumes fell heavily in 2020 and 2021 as travel restrictions reduced movement across Europe.
- Uneven recovery after 2021: Greece recovered in 2022 through 2024, but rejection rates remained higher than in the earlier years.
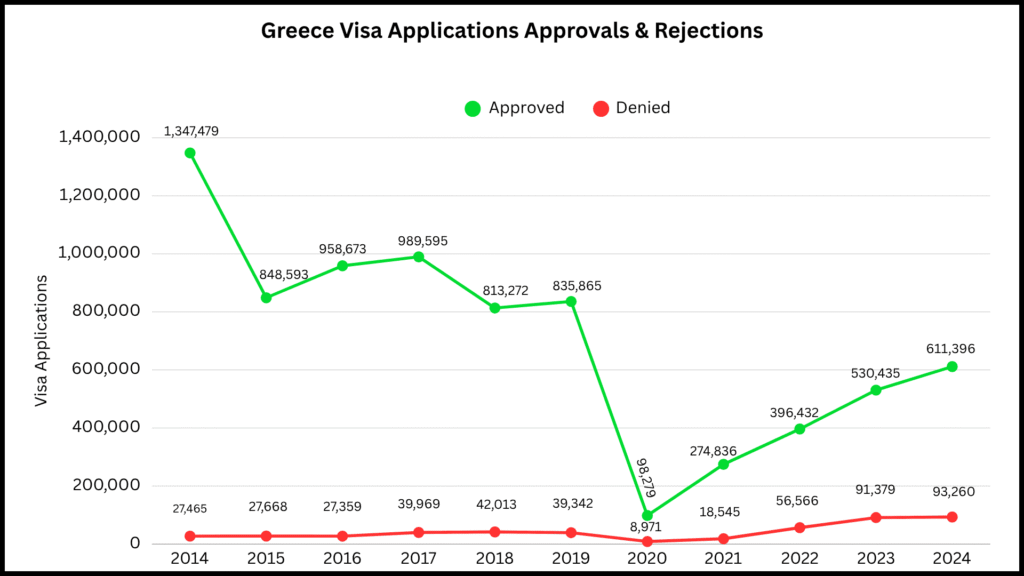
Approval vs Rejection Rates of Greece Schengen Visa Applications (2014–2024)
Approval rates were very high before 2020, then fell during and after the pandemic. In 2024, Greece’s approval rate stood at 86.11%, while the rejection rate was 13.13%. The post-pandemic period shows a much tighter visa outcome pattern than the pre-2020 years.
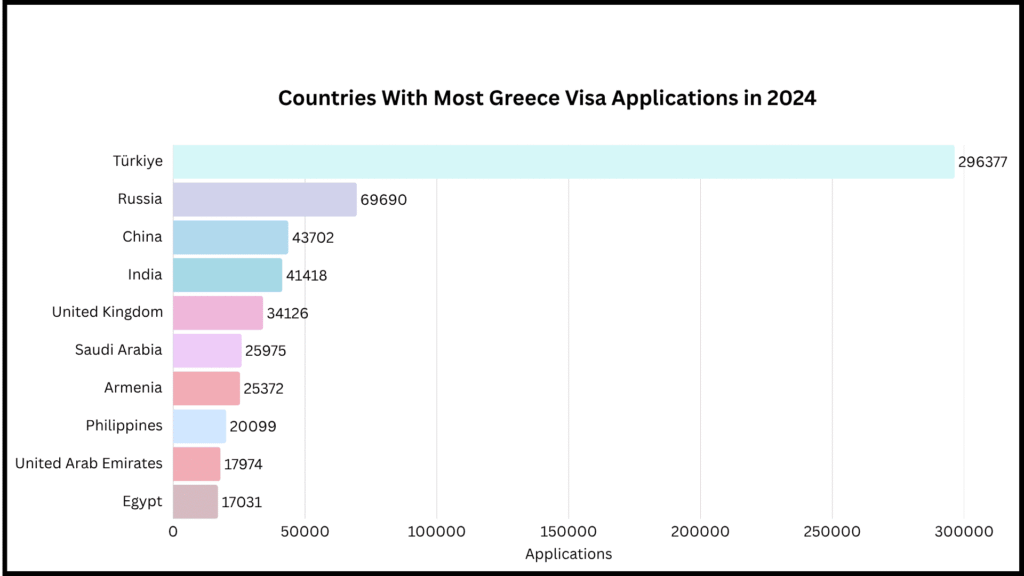
Top Nationalities Applying to Greece
Expenditures
- Visa spending for Greece was very high in 2024. The country received €656,601,680 in visa applications, while €37,802,960 came from rejected applications.
- Turkish applicants spent the most on rejected visas, at €2,517,760.