
The Italy Schengen Visa Statistics highlight strong and consistent demand. Since 2014, Italy has received 15.3 million applications, averaging 1.39 million per year. In 2024, applications reached 1.23 million, up 11.31% from 2023, making Italy the 4th most applied Schengen country with a 10.53% share.
Italy Schengen Visa Statistics & Trends Analysis
- Total applications (2014–2024): 15,317,947.
- Average annual applications: 1,392,541.
- 2024 applications: 1,233,316, up 11.31% from 2023.
- 2024 share of all Schengen visa applications: 10.53%.
- 2024 ranking among Schengen countries: 4th.
- 2024 approval rate: 89.11%.
- 2024 rejection rate: 10.89%.
Italy Schengen Visa Statistics (2014–2024) — Applications, Approvals, Rejection Rates
The yearly breakdown below shows how Italy’s application volumes and decision rates changed from 2014 to 2024.
| Year | Applications | Approved | Denied | Approval Rate | Rejection Rate |
| 2014 | 2,164,545 | 2,083,958 | 80,587 | 96.28% | 3.72% |
| 2015 | 2,023,343 | 1,911,537 | 111,806 | 94.47% | 5.53% |
| 2016 | 1,806,938 | 1,680,638 | 126,300 | 93.01% | 6.99% |
| 2017 | 1,850,260 | 1,708,538 | 141,722 | 92.34% | 7.66% |
| 2018 | 1,844,140 | 1,708,258 | 135,882 | 92.63% | 7.37% |
| 2019 | 2,053,521 | 1,895,964 | 157,557 | 92.33% | 7.67% |
| 2020 | 293,553 | 259,869 | 33,684 | 88.53% | 11.47% |
| 2021 | 212,806 | 191,876 | 20,930 | 90.16% | 9.84% |
| 2022 | 727,490 | 632,453 | 92,186 | 86.94% | 12.67% |
| 2023 | 1,108,035 | 974,540 | 133,495 | 87.95% | 12.05% |
| 2024 | 1,233,316 | 1,098,999 | 134,303 | 89.11% | 10.89% |
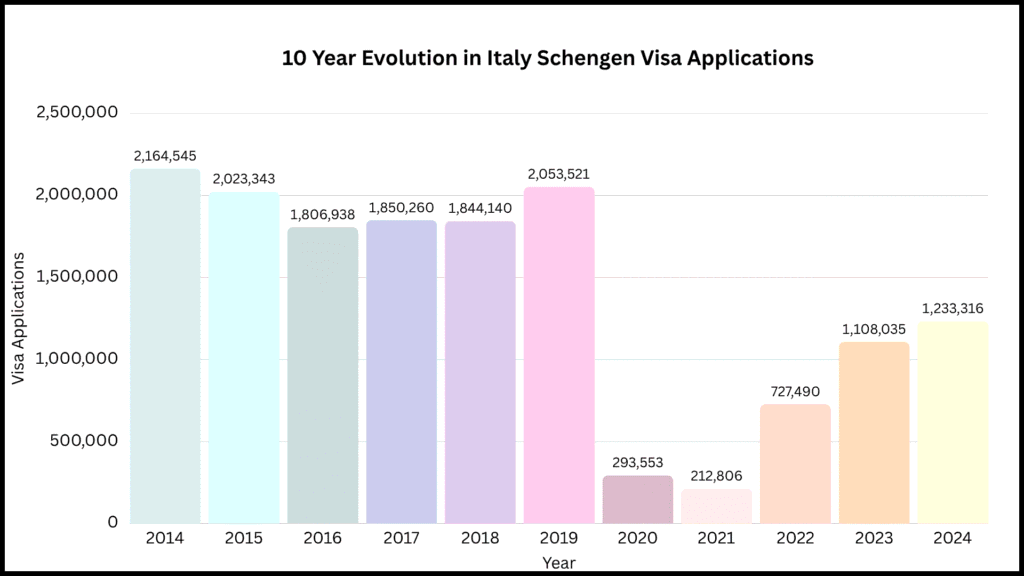
10 Year Evolution in Italy Schengen Visa Application Trends
Italy’s visa demand stayed very strong before 2020, fell sharply during the pandemic years, and then recovered steadily afterward. The strongest rebound came in 2023 and 2024, when application numbers climbed back above the one-million mark.
What the Trend Shows
Italy has remained one of the most popular Schengen destinations across the full 2014–2024 period. The data shows a strong pre-pandemic baseline, a major pandemic slowdown, and a renewed rise in demand after travel reopened.
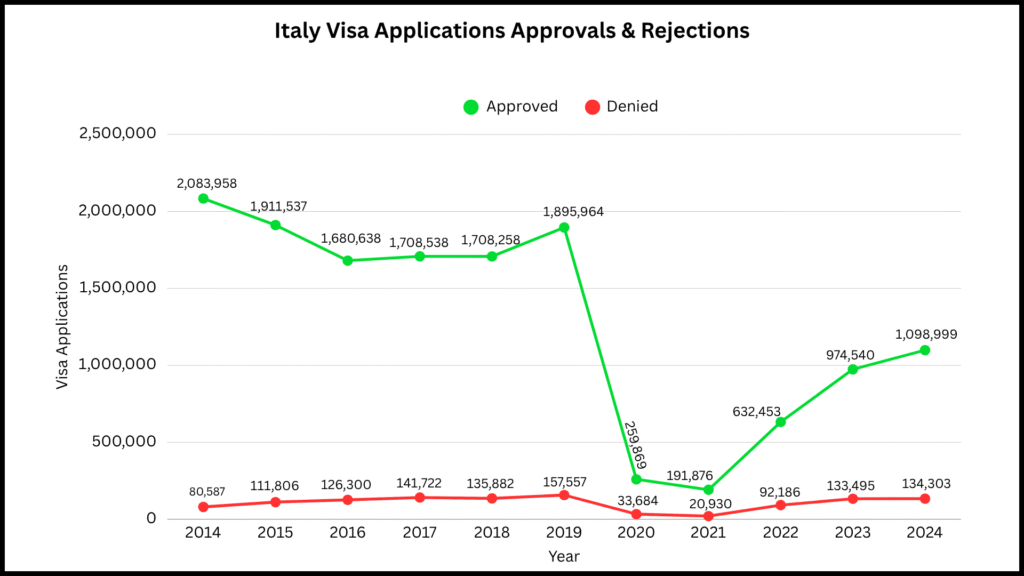
Approval vs Rejection Rates of Italy Schengen Visa Applications (2014–2024)
Italy’s approval rates were highest in the early years of the series and gradually softened over time. In 2024, the approval rate stood at 89.11%, while the rejection rate was 10.89%.
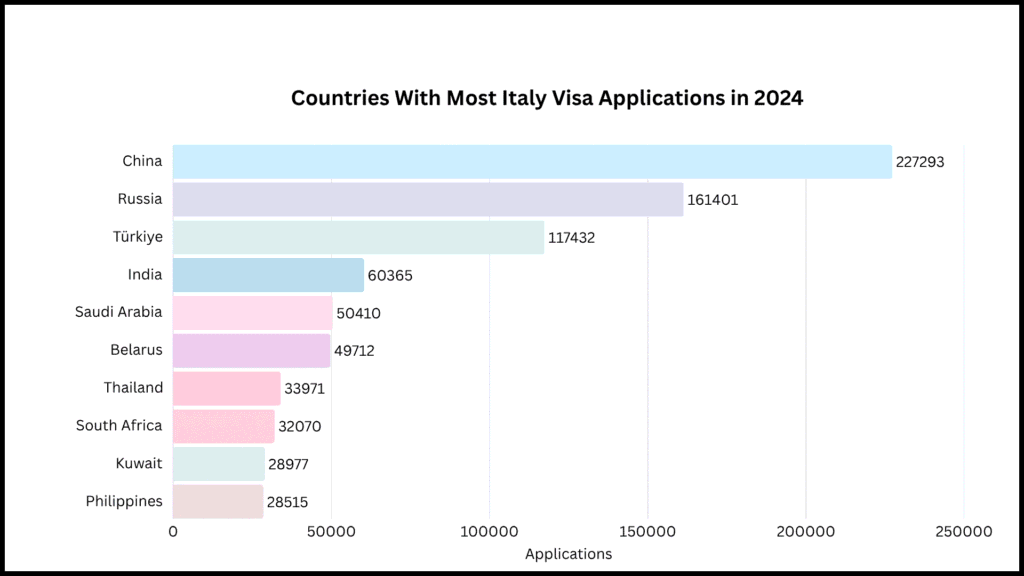
Countries with Most Italy Visa Applications (2024)
In 2024, China remained the largest source of visa applications to Italy, followed by Russia, Türkiye, India, and Saudi Arabia. These countries continue to dominate Italy’s visa demand, reflecting strong travel, tourism, and business ties with the country.
Expenditures on Visa Applications (2024)
Italy received a total of €1,225,435,760 in visa application fees in 2024. Out of this, €93,476,160 came from rejected applications. Turkish applicants accounted for the highest spending on rejected visas, totaling €892,240.