
The Latvia Schengen Visa Statistics show that Latvia is a smaller Schengen destination, but one that still sees steady demand each year. Since 2014, Latvia has received 1,137,840 visa requests, with an average of 103,440 applications per year. In 2024, Latvia received 17,654 applications, down 6.58% from 2023, and it accounted for 0.15% of all Schengen visa applications.
Latvia Schengen Visa Trends Analysis
- Total applications (2014–2024): 1,137,840.
- Average annual applications: 103,440.
- 2024 applications: 17,654, a 6.58% decrease from 2023.
- 2024 share of all Schengen visa applications: 0.15%.
- 2024 ranking among Schengen countries: 25th.
Latvia Schengen Visa Statistics (2014–2024) — Applications, Approvals, Rejection Rates
The yearly breakdown below shows how Latvia’s visa volume and decision rates changed from 2014 to 2024.
| Year | Appications | Approved | Denied | Approval Rate | Rejection Rate |
| 2014 | 207,185 | 205,789 | 1,396 | 99.33% | 0.67% |
| 2015 | 164,000 | 162,213 | 1,787 | 98.91% | 1.09% |
| 2016 | 165,814 | 163,537 | 2,262 | 98.63% | 1.36% |
| 2017 | 166,800 | 164,306 | 2,579 | 98.50% | 1.55% |
| 2018 | 161,709 | 157,711 | 3,374 | 97.53% | 2.09% |
| 2019 | 167,743 | 163,339 | 3,987 | 97.37% | 2.38% |
| 2020 | 30,134 | 29,630 | 827 | 98.33% | 2.74% |
| 2021 | 16,764 | 16,182 | 582 | 96.53% | 3.47% |
| 2022 | 21,140 | 19,030 | 1,989 | 90.02% | 9.41% |
| 2023 | 18,897 | 16,689 | 2,208 | 88.32% | 11.68% |
| 2024 | 17,654 | 15,623 | 1,908 | 88.50% | 10.81% |
10 Year Evolution in Latvia Schengen Visa Application Trends
Latvia’s visa demand stayed relatively stable before the pandemic, then dropped sharply in 2020 and 2021 before recovering modestly in the following years. The source says this reflects a major post-pandemic adjustment in travel demand.
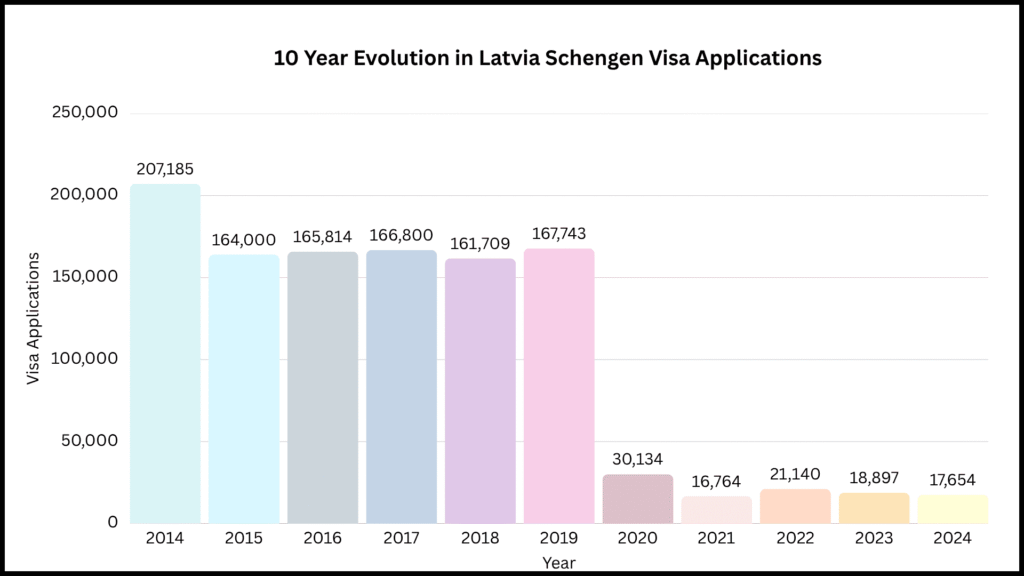
What the Trend Shows
Latvia is not among the most popular Schengen destinations; however, its data clearly shows how trends have evolved over time. While the country experienced stable demand before the pandemic, it then saw a sharp decline during the COVID period, followed by a slower and more gradual recovery. As a result, the 2024 figures indicate that Latvia, although smaller in volume, continues to remain a consistent and steady visa market.
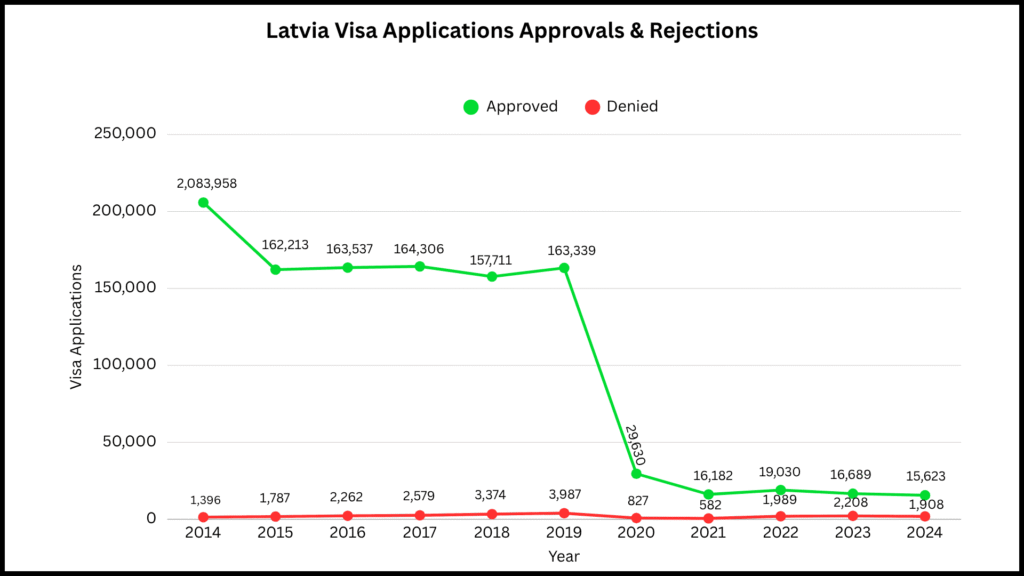
Approval vs Rejection Rates of Latvia Schengen Visa Applications (2014–2024)
Latvia recorded very high approval rates in the early years of the series, with several years above 97%. In 2024, the approval rate stood at 88.50%, while the rejection rate was 10.81%.
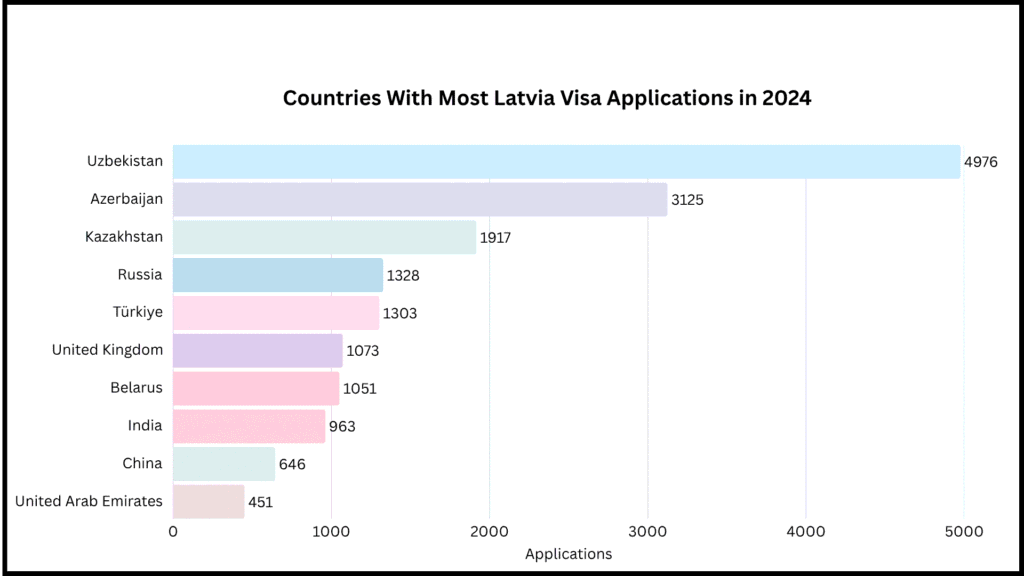
Countries with Most Latvia Visa Applications (2024)
Expenditures on Visa Applications (2024)
In 2024, Latvia received €91,027,200 in visa application fees, and €1,831,920 came from rejected applications. Azerbaijani applicants spent the most on rejected visas, at €41,280.