
Czechia schengen visa statistics (2014–2024) reveal steady growth through 2019, a sharp drop during 2020–2021, and a post-pandemic rebound paired with tighter scrutiny and higher refusal rates. Official European Commission visa tables underpin these figures and highlight clear shifts in Schengen visa application trends and Schengen visa approval rates for Czechia.
Latest Czechia Schengen Visa Statistics 2024: Applications, Approval Rates & Rejection Trends (2014–2024)
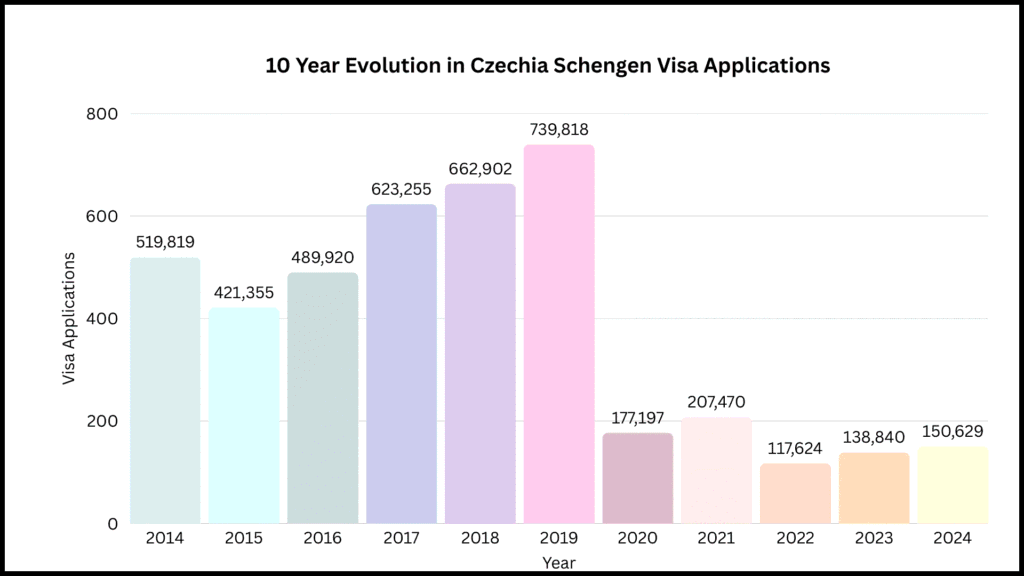
| Year | Applications | Approved | Denied | Approval Rate | Rejection Rate |
| 2014 | 519,819 | 508,310 | 11,509 | 97.79% | 2.21% |
| 2015 | 421,355 | 408,092 | 13,263 | 96.85% | 3.15% |
| 2016 | 489,920 | 470,709 | 19,062 | 96.08% | 3.89% |
| 2017 | 623,255 | 595,319 | 27,936 | 95.52% | 4.48% |
| 2018 | 662,902 | 631,581 | 31,206 | 95.28% | 4.71% |
| 2019 | 739,818 | 700,889 | 38,929 | 94.74% | 5.26% |
| 2020 | 177,197 | 167,498 | 9,699 | 94.53% | 5.47% |
| 2021 | 207,470 | 200,456 | 6,916 | 96.62% | 3.33% |
| 2022 | 117,624 | 100,683 | 16,941 | 85.60% | 14.40% |
| 2023 | 138,840 | 114,610 | 24,218 | 82.55% | 17.44% |
| 2024 | 150,629 | 126,894 | 23,735 | 84.24% | 15.76% |
Czechia Schengen Visa Statistics on Applications (2014–2024)
Czechia Schengen Visa Statistics – Approval & Rejection Rate (2014–2024)
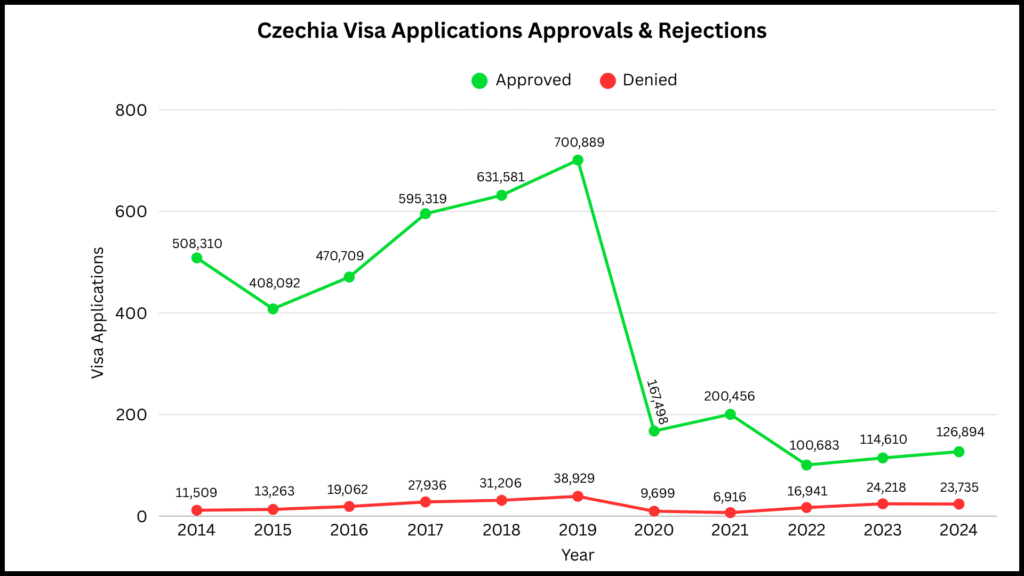
What the Czechia Visa Statistics Charts Tell You
- Pre-2020: consistently high Schengen visa approval rates.
- 2020–2021: massive drop in Schengen visa requests due to travel restrictions.
- 2022–2024: approval rates fell and Schengen visa rejection statistics rose sharply. EC tables show higher refused counts in 2022–2024 vs pre-pandemic years.
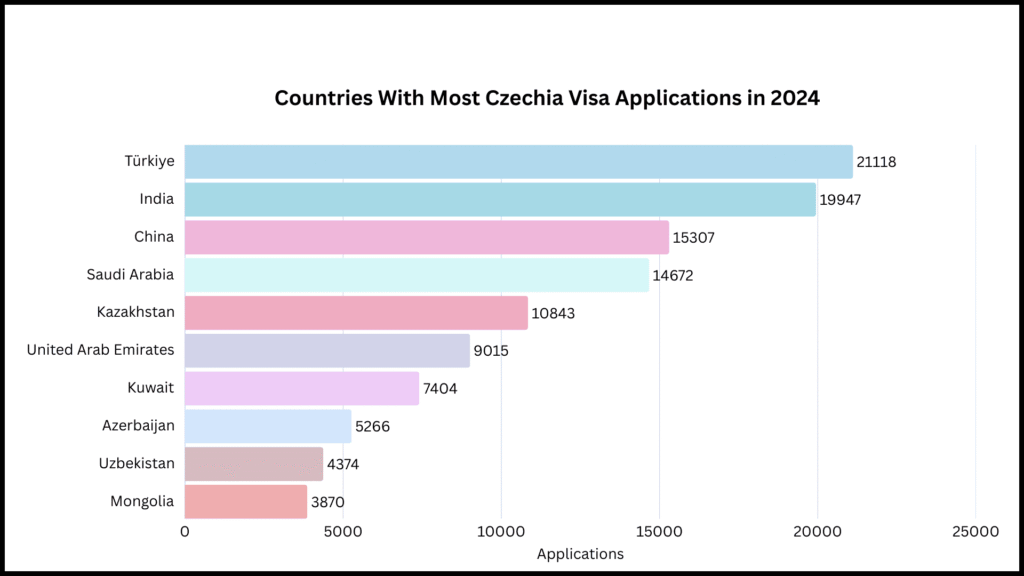
Statistics on Top Nationalities Applying for Czechia Visa (2024)
The European Commission consulate breakdown shows that the largest shares of applications for Czechia in 2024 came from Turkey, India, China, Saudi Arabia, Kazakhstan, and the UAE, driving much of the observed Czechia visa statistics 2024. These origin markets explain a large part of current Schengen visa demand for Czechia, and visa approval rates differ notably by nationality.
Expenditures
- Czechia received €276,565,520 in visa application expenditures.
- Expenditure levels were highest for Russia applicants, totaling €118,408,720.
- A total of €11,352,400 was spent on refused visas in the country.
- Ukraine applicants spent the most on refused visas, totaling €2,263,280.