
Estonia is not among the most popular destinations for short-stay travel: since 2014 the country has recorded 949,998 Schengen visa applications (an average of ≈86,363 per year), reflecting strong pre-2019 volumes, a pandemic-era collapse and an uneven recovery patterns that appear clearly in the Estonia schengen visa statistics (2014–2024).
Key Takeaway on Estonia Schengen Visa Statistics & Application Trends (2014–2024)
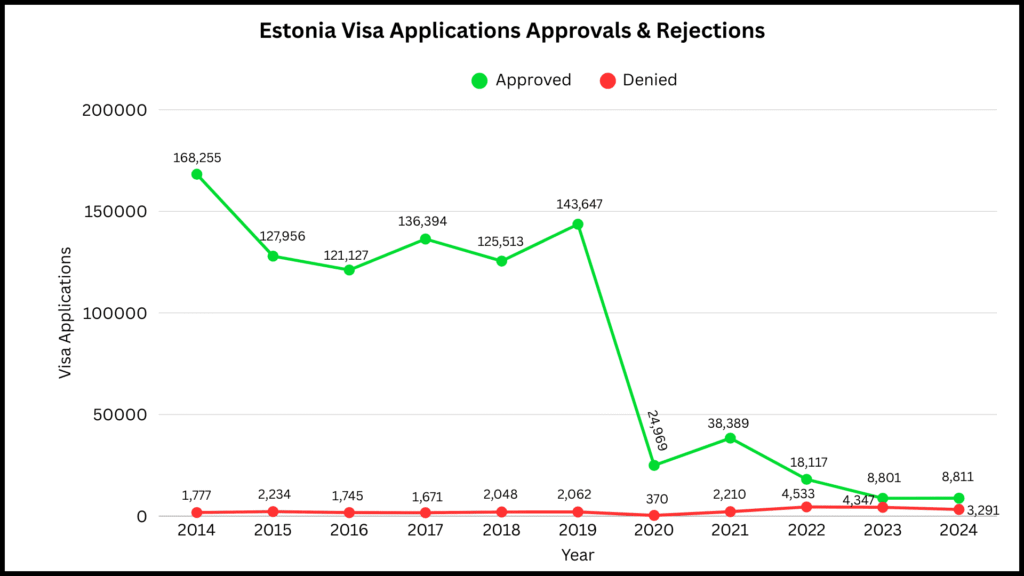
- Estonia received 12,125 Schengen visa applications in 2024 (8,811 approvals, 3,291 rejections). This is a drop vs 2023.
- From 2014–2024 Estonia recorded ~950k total visa requests (sum of annual rows below). Use caution: small-country counts swing a lot year-to-year.
- Approval rates collapsed during the recovery years (2022–2024) then partially recovered — watch the rejection share rise when volumes are low.
- For reproducibility, the canonical dataset is the European Commission short-stay visas table — I cross-checked with national EMN materials and SchengenVisaInfo summaries.
Estonia Schengen Visa Statistics (2014–2024) — Applications, Approvals, Rejection Rates
| Year | Applications | Approved | Denied | Approval Rate | Rejection Rate |
| 2014 | 170,731 | 168,255 | 1,777 | 98.55% | 1.04% |
| 2015 | 130,197 | 127,956 | 2,234 | 98.28% | 1.72% |
| 2016 | 122,872 | 121,127 | 1,745 | 98.58% | 1.42% |
| 2017 | 138,249 | 136,394 | 1,671 | 98.66% | 1.21% |
| 2018 | 127,561 | 125,513 | 2,048 | 98.39% | 1.61% |
| 2019 | 145,711 | 143,647 | 2,062 | 98.58% | 1.42% |
| 2020 | 25,554 | 24,969 | 370 | 97.71% | 1.45% |
| 2021 | 40,657 | 38,389 | 2,210 | 94.42% | 5.44% |
| 2022 | 23,151 | 18,117 | 4,533 | 78.26% | 19.58% |
| 2023 | 13,190 | 8,801 | 4,347 | 66.72% | 32.96% |
| 2024 | 12,125 | 8,811 | 3,291 | 72.67% | 27.14% |
Estonia Schengen Visa Statistics: Yearly Application Trends
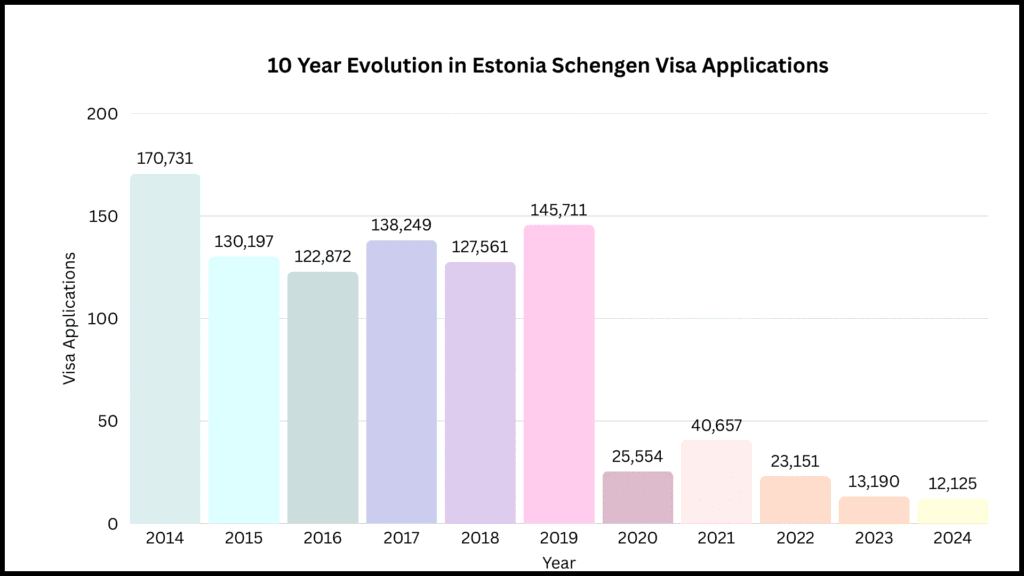
What the Trend Shows
- Pre-2019: steady, high approval rates (≈98%) — most denied cases were tiny in number.
- 2020: sharp collapse (travel bans) — Applications fell from ~145k (2019) to 25.5k (2020).
- 2021–2024: choppy recovery — volumes stayed low and rejection share increased as processing patterns changed.
Approval vs Rejection Rates of Estonia Schengen Visa Applications (2014–2024)
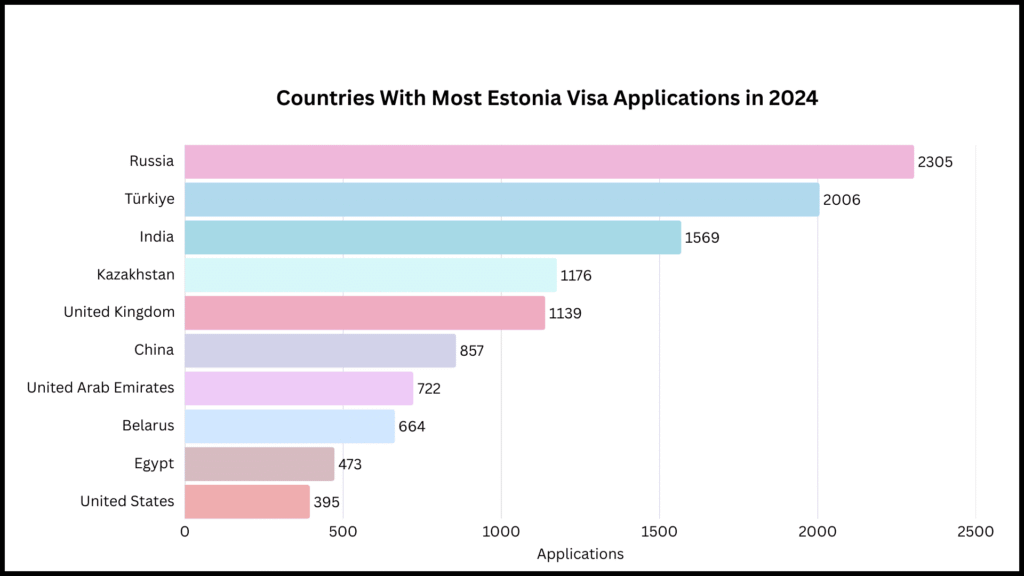
Top Nationalities Applying to Estonia
Expenditures — What Applicants Paid
- Total declared application value (2024): €75,999,840 (aggregate of application fees attributable to Estonia applications).
- Revenue from rejected apps (2024): €2,103,040 — real sunk cost for refused travellers.
- Turks spent most on rejected visas with €48,000.
Pandemic Effect & Pre-Pandemic Baseline
- Pre-2020 baseline: Estonia’s 2014–2019 average stayed high with tiny rejection shares — these years are the “normal” comparator.
- 2020–2021: travel bans collapsed numbers. 2021 saw a partial bump.
- 2022–2024: demand remained weak vs pre-pandemic and rejections as a share rose — smaller flows make percentages jump.