
Finland schengen visa statistics across 2014–2024 show clear phases: a strong pre-2019 baseline, a steep decline during 2020–2021, and a partial, uneven recovery through 2022–2024. The series includes annual application counts, approval and rejection rates, top origin countries, and mission-level processing notes.
Finland Schengen Visa Statistics & Trends Analysis
- Total applications (2014–2024): 5,577,377 (sum of annual rows).
- 2024 snapshot: 90,611 Finland visa applications (-1.59% vs 2023); ranked 18th among Schengen countries for 2024.
- 2024 approval / rejection: Finland visa approval rate ≈ 83.45% ; rejection ≈ 14.94%.
- Processing time reference for short-stay: Standard decision window 15 calendar days; extensions possible up to 45 days under special circumstances (legal Visa Code reference).
Finland Schengen Visa Statistics (2014–2024) — Applications, Approvals, Rejection Rates
| Year | Applications | Approved | Denied | Approval Rate | Rejection Rate |
| 2014 | 1,205,034 | 1,192,772 | 12,262 | 98.98% | 1.02% |
| 2015 | 784,286 | 773,718 | 9,571 | 98.65% | 1.22% |
| 2016 | 550,046 | 540,918 | 7,984 | 98.34% | 1.45% |
| 2017 | 827,520 | 816,789 | 9,337 | 98.70% | 1.13% |
| 2018 | 769,049 | 754,410 | 13,439 | 98.10% | 1.75% |
| 2019 | 895,775 | 877,759 | 16,894 | 97.99% | 1.89% |
| 2020 | 137,536 | 132,936 | 5,061 | 96.66% | 3.68% |
| 2021 | 61,015 | 55,882 | 2,745 | 91.59% | 4.50% |
| 2022 | 164,427 | 144,885 | 15,530 | 88.12% | 9.44% |
| 2023 | 92,078 | 72,973 | 16,602 | 79.25% | 18.03% |
| 2024 | 90,611 | 75,614 | 13,536 | 83.45% | 14.94% |
10 Year Evolution in Finland Schengen Visa Application Trends
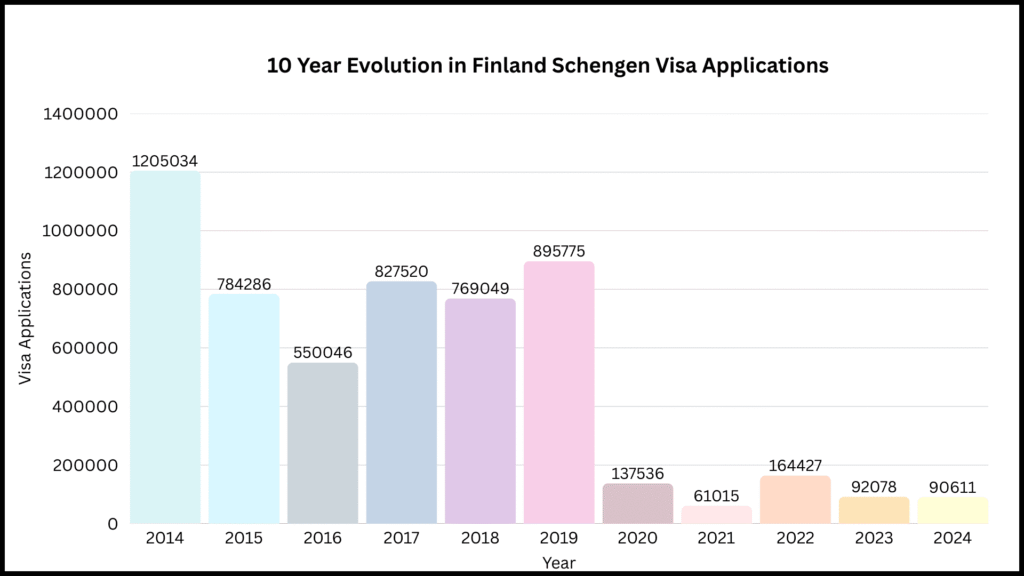
What the Trend Shows
- High pre-2019 approvals: Approval percentages in 2014–2019 remained near or above 97% in most years; denials were comparatively tiny. Finland Schengen visa statistics reflect that pattern.
- Sharp pandemic collapse (2020–2021): Travel restrictions and consular slowdowns pushed volumes to single-digit percentages of pre-pandemic levels. Schengen visa application trends across the EU mirror this.
- Post-2021 recovery uneven: 2022 saw a rebound; 2023–2024 stabilized at lower volumes than the pre-2020 baseline, while Schengen visa rejection statistics increased in share.
Approval vs Rejection Rates of Finland Schengen Visa Applications (2014–2024)
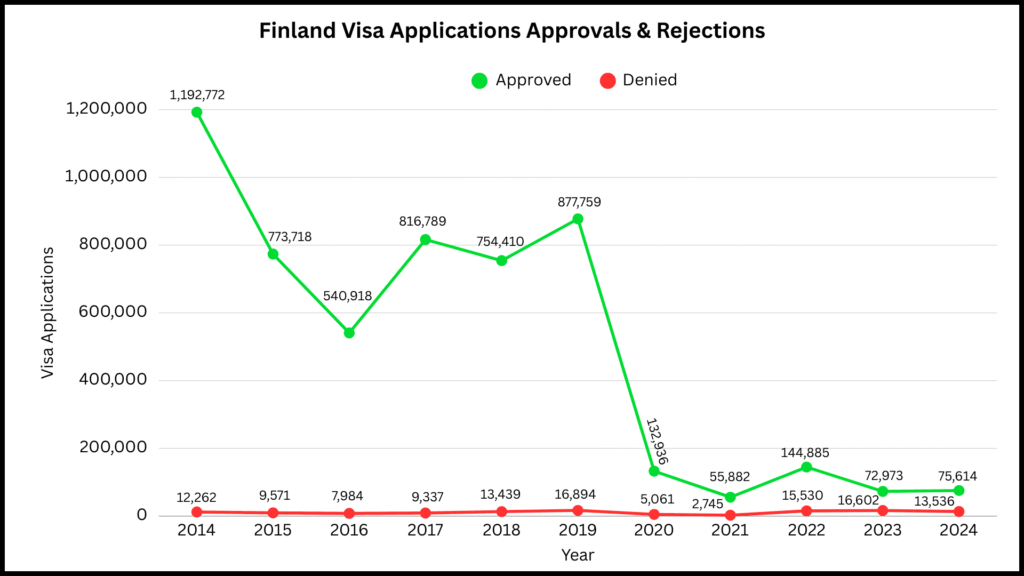
Approval share dropped from pre-2020 highs to a low in 2023 and partially recovered in 2024 (≈83.45%). Elevated rejection shares in 2022–2023 indicate stricter checks and different applicant mixes. Schengen visa approval rates and Schengen visa rejection statistics require mission-level context for precise interpretation.
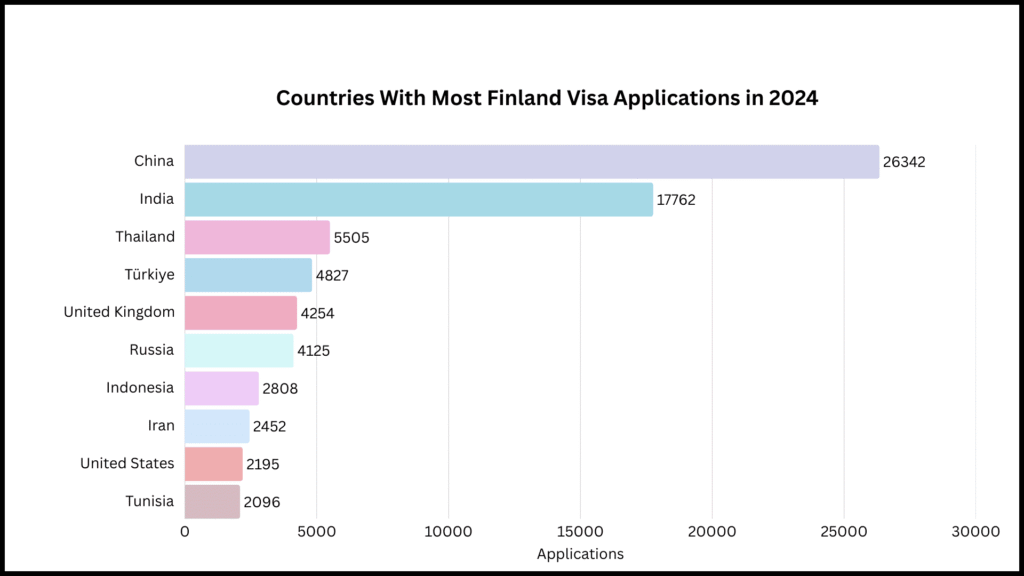
Top Nationalities Applying to Finland
Expenditures
- Total declared application value (2024): €446,190,160 (aggregate reported receipts).
- Revenue from rejected apps (2024): €9,836,880 (sunk cost for refused applicants).
- Highest rejected-app spend by nationality: India (reported highest rejected spend in some breakdowns). Use these figures when presenting top Schengen destination visa stats and economic impact.
Pandemic Effect & Pre-Pandemic Baseline
- Pre-2020 baseline (2014–2019): Large annual counts and very high approval rates (aggregate pre-pandemic total ≈ 5,031,710 applications across 2014–2019 for Finland in the source breakdown).
- Pandemic years (2020–2022): Average yearly applications down by ~65.90% over the pandemic period; origin markets shifted with Russia, Thailand and India prominent in those years.